Monitoring, logging and data pipelines
Problems should reach us before they reach your customers. Sentry catches errors, Datadog, New Relic, Prometheus and Grafana watch performance, the Elastic stack keeps searchable logs, and Kafka, RabbitMQ and Spark move and process data when a product grows beyond a single database.



The stack
See errors, performance and events as they happen.
- SentryError and performance monitoring, so we hear about problems first.
- DatadogMetrics, traces and logs across the whole stack.
- New RelicApplication performance monitoring at scale.
- DynatraceAutomated observability for enterprise systems.
- PrometheusOpen-source metrics and alerting.
- GrafanaDashboards that make metrics readable.
- ElasticSearch and observability on one platform.
- LogstashCollects and shapes logs from every service.
- KibanaExplore logs and metrics visually.
- Apache KafkaEvent streaming between services at scale.
- RabbitMQReliable message queues for background work.
- Apache SparkLarge-scale data processing and reports.


Why it matters for your business
- Problems caught before customers noticeError tracking and uptime monitoring alert us the moment something breaks.
- Performance you can measureResponse times, slow pages and traffic trends on dashboards, not guesses.
- Searchable historyFind what happened to a specific order, user or request in seconds when a question comes in.
- Reliable at scaleQueues and streams keep orders, emails and reports flowing when traffic spikes.
If you cannot see it, you cannot fix it.
Most outages are small and silent: a payment webhook that stopped, a form that errors on one browser, a page that got slow after a content change. Without monitoring they run for weeks. With it they are fixed in minutes.
We add Sentry for errors on every project, dashboards with Grafana, Datadog or New Relic where performance matters, the Elastic stack for searchable logs, and Kafka or RabbitMQ when a product needs reliable pipelines between services.
Monitoring on our projects is set up before launch, not after the first incident. Errors are grouped and reported with enough context to fix them, uptime checks run from several regions, and the metrics that matter to your business, such as orders per hour or booking failures, sit on the same dashboard as server health. Alerts are tuned so they fire when something is wrong and stay quiet otherwise. When data has to move between systems, we document each pipeline, add retries and dead-letter handling, and make sure a failure is visible rather than silent.
How we work with it
- 1
Audit and plan
We review what you have, define the goal and write a proposal with scope, timeline and cost.
- 2
Design and prototype
Structure and screens in Figma, approved by you before any code is written.
- 3
Build in sprints
Short cycles with a demo at the end of each, on a staging environment you can test.
- 4
Launch and support
Deployment, monitoring, training and a backlog for the next phase.



Questions and answers
All technologies
 FrontendInterfaces in React, Next.js, Vue and Angular.
 BackendAPIs, authentication and the logic behind the screen.
 DatabasesThe right store for every kind of data.
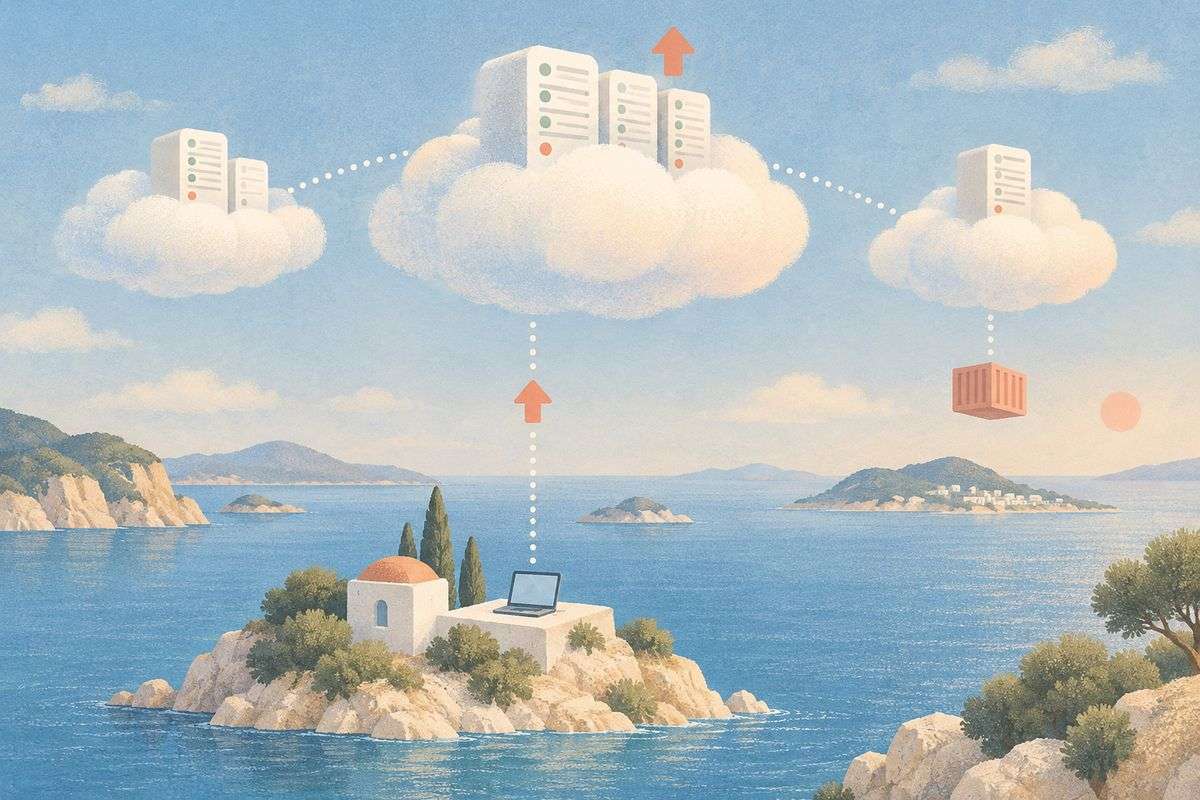 Cloud and DevOpsHosting, deployment, containers and CI/CD.
 Tooling and workflowBuild tools, linting and monorepos that keep code healthy.
 Testing and QAAutomated tests that catch problems before customers do.
 Mobile appsiOS and Android apps, native or cross-platform.
 Design and collaborationDesigned in Figma, planned in the open.
 Analytics and growthMeasure what matters and keep in touch.
 Payments and e-commerceOnline shops and payments that just work.


Get a quote for your monitoring setup
Every project is quoted individually after a short call. Tell us about your business and you will get a written proposal with scope, timeline and cost within one working day.
- 1We reply within one working day
- 2A short call to understand your goals and what you have today
- 3A written proposal with scope, timeline and cost, no obligation